


The Good Old Days
Purchasing Power Stuff


In daily life, I constantly hear the phrase: “life is so expensive nowadays”…
This often comes from people who have, or appear to have, a lot of financial safety. People say this all the time in Western economies— the US, Europe, LATAM, etc.

What Does “life is so expensive nowadays” Even Mean?
People in the same country, city, or even neighborhood can have vastly different daily experiences. At their core, resources shape these differences in experience.
Resources: a useful and/or valuable possession or quality. Being smart is a biological/genetic resource, being athletic is as well, mental health is an operative resource, a house, money, etc. They are all resources used by people for specific ends.
By “life” they usually mean a combination of their needs and wants - goods and services. Expensive, by definition, means costing a lot of money (duh).
This phrase is telling us, more formally: ‘I perceive, or know, that my current financial income and/or wealth has diminished in purchasing power, and my experience in life has started to feel less secure and/or enjoyable because of it’. This is how I interpret the statement and how I will frame the article.
This is still vague, because needs and wants differ amongst people. Someone who has ADHD has the need for ADHD medication, while most other people don’t. Maybe they want it as a recreational, but they don’t formally need it. I know people who have tacitly told me, with a straight face: “I don’t have a dime, last month I had to change the entire sound system on the jet”. And the crazy thing here is that, the expression everyone utters (life now expensive) can also be applied to his particular case.
Averages help us grasp this phenomenon at a macro scale, smoothing out skewed perceptions. Obviously, a broken jet sound system isn’t a problem for 99.999% of people. But, for those 0.001% of people, luxury goods are, unsympathetically, a very important resource. They can even be justified as operational expenses or business expenses as investments. But I digress.

Humanity understands there are needs more important than others and wants less important than others. Food, shelter, schooling, medical care, etc. are, evidently, much more socially required as fundamental needs. I decided to check the numbers to see if anecdotal claims hold up.
Main Indicators of Purchasing Power
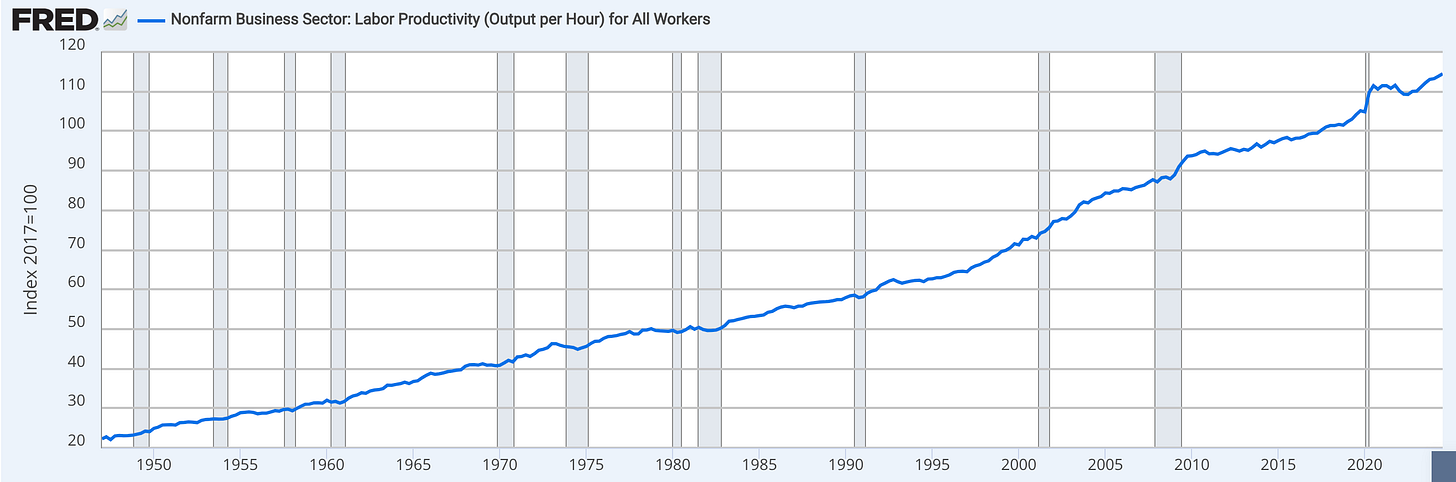
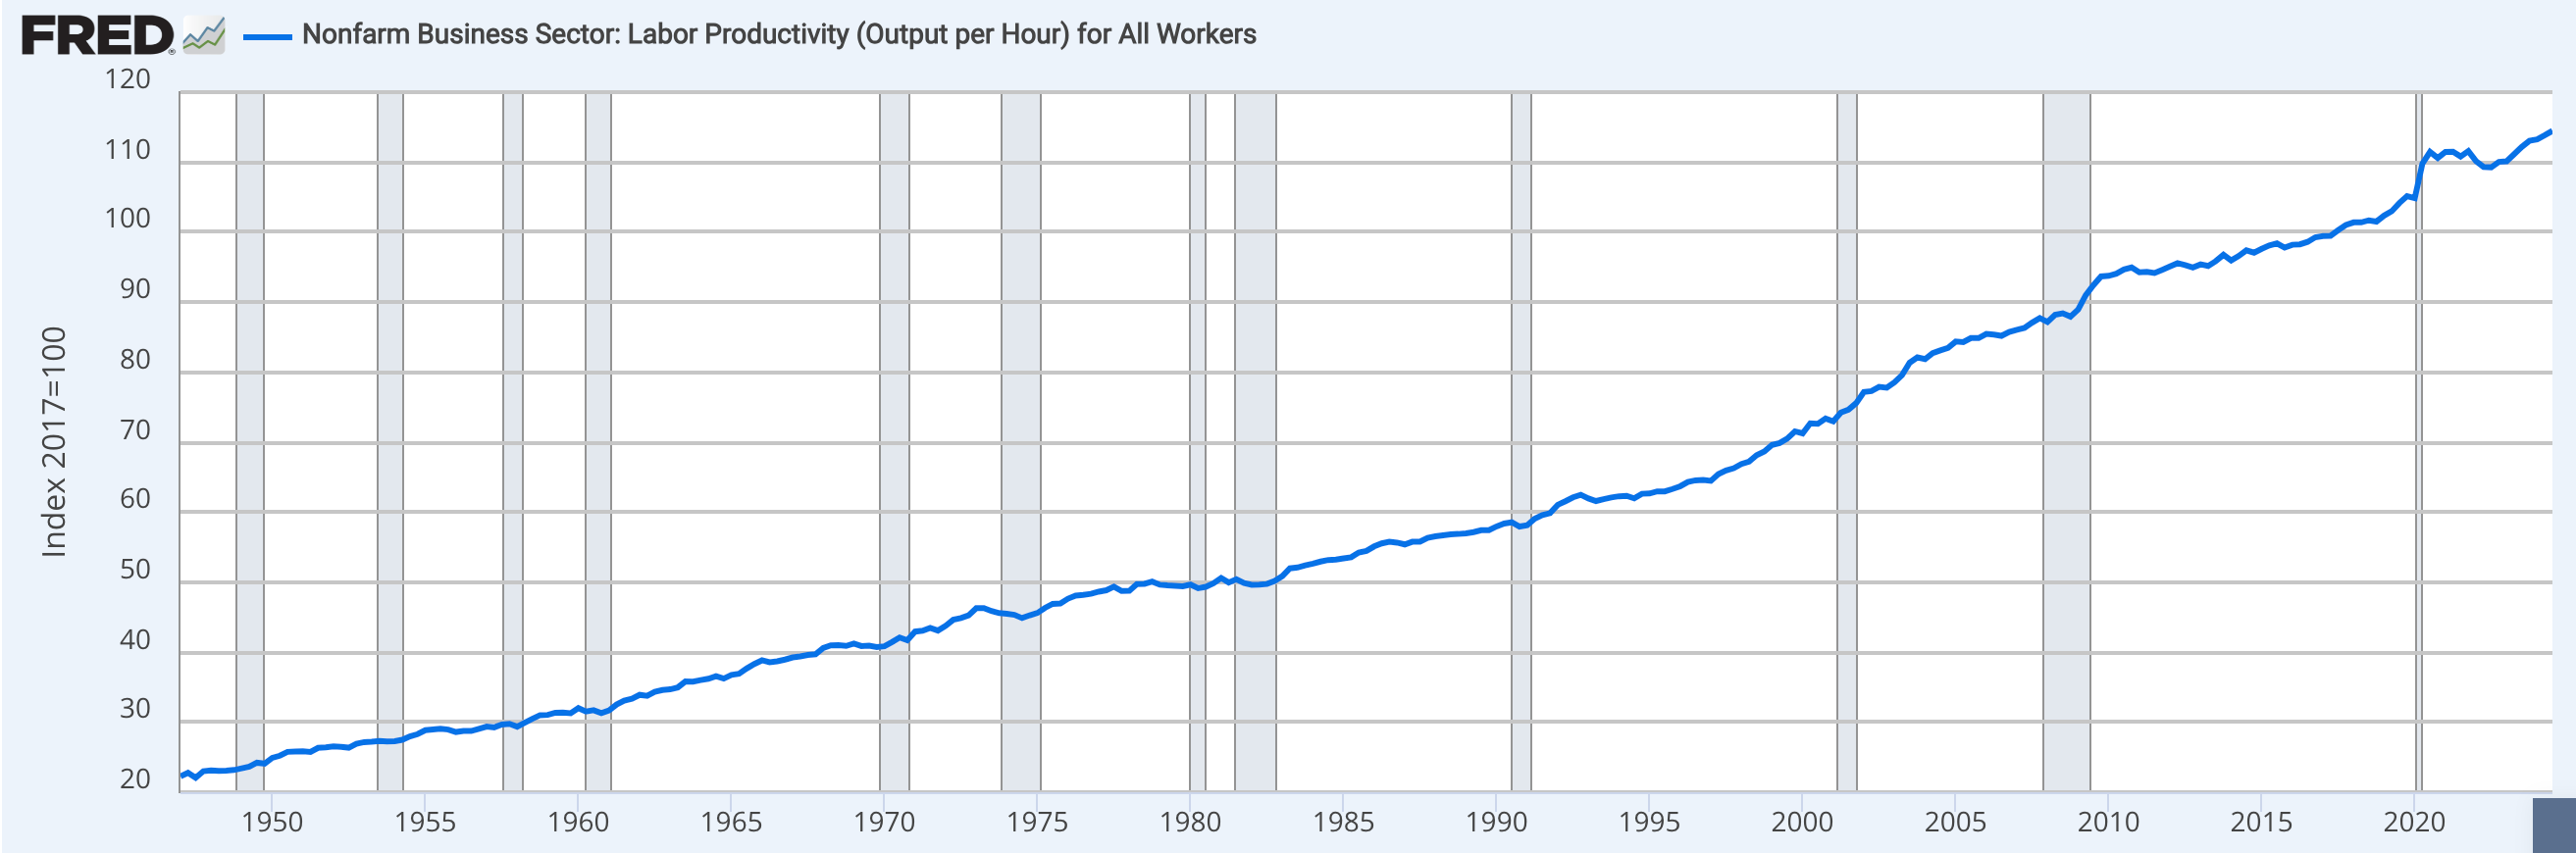
The CPI is an economic index that tries to track increases on dollar cost of living by doing a weighted average of the average goods consumed by average US household. If we compare it to the average salary we should have some sort of idea for acquisitive power for US households. Below is a comparison (FRED, SSA):
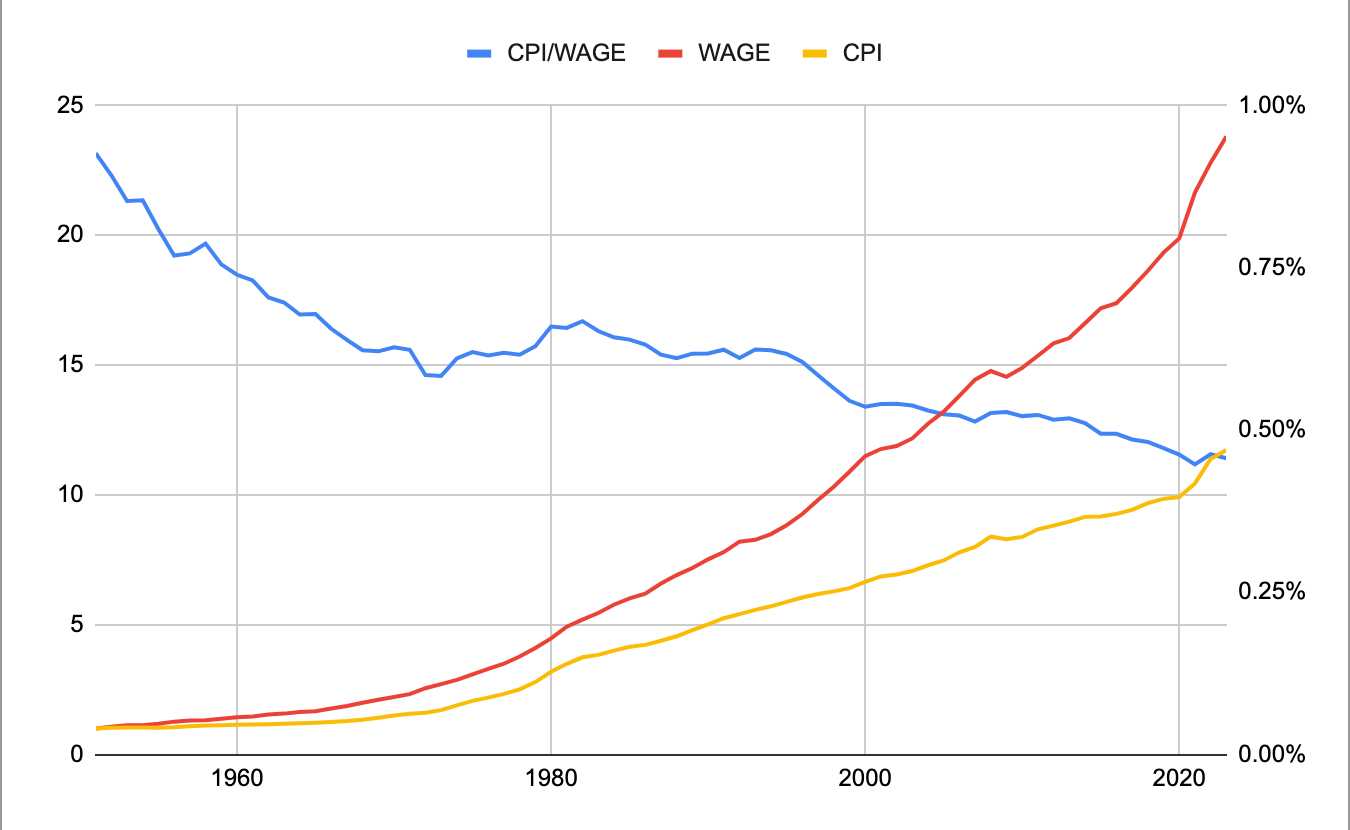
This graph tells us pretty much the exact opposite of what people say. According to this, salaries have gone up in a higher proportion to (monthly expenditures) prices. So, they’re wrong, everything is great, and you shouldn’t worry about inflation. Go watch some Tim Dillon and chill. Or were they?

Above we considered the Average yearly wage of a US employee. An average, colloquially, refers to an arithmetic mean. In finance, statistics, etc. there are other types of means or operations that are better at mitigating the effect of outliers, resulting in a number that better explains the generality of the current state.
By outliers we mean individual data points that are extremely above or below the rest of the data points in a set. These outliers move the average value away from a number more representative of the population. When we have outliers, operations like the Geometric Mean or the Median (useful when they are negative numbers in a set), are looked upon for improved numerical conclusions over the arithmetic mean. Below is an example of how these three operations yield different results:

I couldn’t find geometric means for wages, but the median was available. Given a large dataset, it is unlikely that we will find extremely high variability in mean results like we see above, but it will be a fairer representation. Below we have the change in Average Salary, Median Salary and CPI. As we can see, the Median starts to hug the CPI change much closely as opposed to the average, the Median-Average spread is not trivial.

Why? Income tends to concentrate. Top earners vastly outperform the average, making them statistical outliers. The difference in the last datapoint for the Median vs Average was almost 20% difference in salaries, favoring the average.

The result was better, but it still doesn’t prove the average Joe’s purchasing power has fallen over the last 44 years. Actually, in general, it tells us they are richer.
Individual Goods
Let’s get more specific for a bit. I’m going to try to use Median values when possible to remove the outliers. On these graphs, we interpret as follow:
If the prices (CPI) increase in higher proportion than the Median Wages, means things are more expensive, meaning quotient (division) is going to increase, and vice versa. This is a simple way of calculating directionality, not a very sophisticated way to calculate actual purchasing power and the number itself doesn’t matter much, direction is what is important.
The CPI for new cars shows wages have risen faster than prices. So buying a (normal) car is not what is getting people to complain about prices.

Food has consistently become cheaper.

Energy follows a more horizontal trend with more volatility, because of the geopolitical implications of energy production. Overall, it is not more expensive in real terms now than it has been on average throughout the last 40 years.

Are people just insane? Everything looks cheaper. Well, I don’t think so. Below are more CPIs
Increasing Line Graphs
Services have become more expensive. This picked up on the1980s and has stabilized since. Interesting, especially considering how much the US economy has become service/subscription based. Gyms, apps, software, ChatGPT, etc. Companies have figured out that subscription services are a great way to have recurrent revenue, lower barriers of entry for their products, higher retention, etc. Overall, services have become less expensive in the last 10 years, but the general trend has been a long term increase in prices.

Lots of people talk about healthcare, and how it’s super expensive in the US:

Seems like healthcare has actually been becoming more expensive. It has eased up since the pandemic, but in the last 44 years it has become harder to afford. This is very important. Behaviorally, having trouble affording healthcare is something that must be extremely stress inducing, as well as being tragic from a human perspective.
We constantly hear 'housing crisis' in the news— but what’s the fuss about? Well, here is where we give you the big enchilada,

Here’s a graph showing median house prices relative to yearly salaries. House prices, relative to median salaries, have very much increased through all decades. Which means it has become a lot more expensive, in real terms, to purchase and own a house in the last 45 years.

Why is this the big enchilada? Most Americans (excluding unhoused, children, etc.) pay for shelter in one way or another as a big monthly expense. Whether it's through rent or purchase prices (mortgages), housing represents an increasing share of US persons’ expenses.

CPI Weights
Without deep analysis, we can look at how expenses break down by category.
Where do people spend each share of their income? Say that super-yachts went up 200% in price last year, would that have a big impact on the average American? No, 99.9% of Americans are not affected by yacht prices blowing up. Housing, on the other hand, is a fundamental expense that most people will have to pay for with a substantial share of their monthly expense allowance.
Big categories are as follows from the BLS site. These categories don’t necessarily line up with the above graphs, and some subcategories of each category intersect so assume this is a rough analysis:

One of the goods that has been becoming more expensive, housing (measured with Housing price as a proxy) is almost 40% of the monthly expenditure for American families.
We see that some things got more expensive, and others got cheaper, which one wins? Easy, according to the CPI, cheaper wins, average Americans have more purchasing power now than ever. But, we have add more nuance to the story, otherwise we would be being lazy, like I was on my article about linear regression:

Even though the CPI accounts for share of expense allowance in Inflation, there is probably a subjective aspect to the discontent, same as in healthcare, that must be important to US consumers about the stress of more of their income share going to rent, even though everything else is cheaper, having less disposable income in excess of housing might be psychologically burdensome.
The American Dream dictated owning a picket fenced house with a large yard as a reward for your efforts in the labor market. Boomers got to enjoy it; Millennials didn’t as much and GenZ seems to be on the way to even worse conditions to home ownership. The disconnect between expectation and reality can also be a rough hit.
Add one extra piece of the puzzle: savings + investments as a share of Disposable Income have been decreasing. So people are saving less, making the CPI weights an even better proxy for expenses as a share of income and, potentially, a source of discontent as savings are something that gives people security. The increase in real income (purchasing power), matched with this data point, might indicate that people are spending money on goods that the basic CPI basket doesn’t account for properly (more on that below). It could also be a dead end and just be some fiscal thing, cyclical thing or something of that sorts…

Overall purchasing power for basic goods has increased, average life should be cheaper. But people don’t always want average.
PJ Monthly Allowance
Reminisce on the saying: Money doesn’t change people; it just reveals who they really are… As Americans become richer and richer, luxury spending - associated with a natural human status-seeking behavior, has blown up. Especially for Millennials and GenZ. The specifics on the evo-psych lie outside this article.
Luxury goods include sports cars, designer apparel, designer jewelry, high-end liquor, high-end electronics, etc. On the other hand luxury experiences or services include things like golf club memberships, business travel tickets, high end dining, high end hotels, VIP nightclub service, etc. Basically, non-essential goods and services that are usually priced many multiples of magnitude above their “average” or essential counterparties.
Here is a very particular example:
The Bugatti Veyron made a debut in 2005 and it was the first production car to reach the 400km/h mark. At the time, its price tag was unmatched by any non collectible production road-legal car, at about 1.2M USD. Since 2005 we have seen 61% inflation in the US, meaning that, if the inflation of this Hyper-Cars was in line with CPI, a modern version of the Veyron should cost about 1.9M USD. The Bugatti Tourbillon, second successor for the Veyron is starting at about 4.6M USD… meaning the Bugatti inflation was of 14% per year, multiple times larger than CPI.

This is a common occurrence amongst luxury goods, below we have a comparison for about 40 years for CPI vs a Forbes index that tracks “luxury inflation” called CLEWI or Cost of Living Extremely Well Index

The results are very interesting. Luxury goods increase in price a lot faster than basic goods.
There is a concept called a hedonic adjustment in CPI calculation.
The Tourbillon has superior features than the Veyron, you are not getting just a newly produced Veyron. The design is better, efficiency is also better, performance is better, etc. This can also apply to IPhones, Computers, etc. (On the other hand, things like a LV handbag are pretty much the same thing they were 20 years ago, maybe some regulations on materials changed or something, but the product is essentially the same and offers the exact same usability with a different design.)
These hedonic adjustments are meant to capture this difference and only attribute to CPI what is not a quality improvement that increased price. Instead, CPI tries to isolate the effect of monetary inflation, the Milton Friedman kind.
Below there is a graph of CPI vs CLEWI (Cost of Living Extremely Well Index) and the Forbes 400 wealth (indexed)

Turns out that the top earner’s income and wealth increase by several orders of magnitude relative to CPI and even to CLEWI, meaning they have the power to, potentially, price out even 2.5%-ers from some luxury goods/services. Also, as we saw above, if you are upper middle class but you wage increase fails to keep up with CLEWI you might feel your purchasing power fading away.
With not a lot of research, my guess is that gross margins for high end luxury goods increase a lot and then they introduce entry level versions of their brand products which squeeze the margins a bit more but reintroduce 2.5%-ers to the luxury brand.
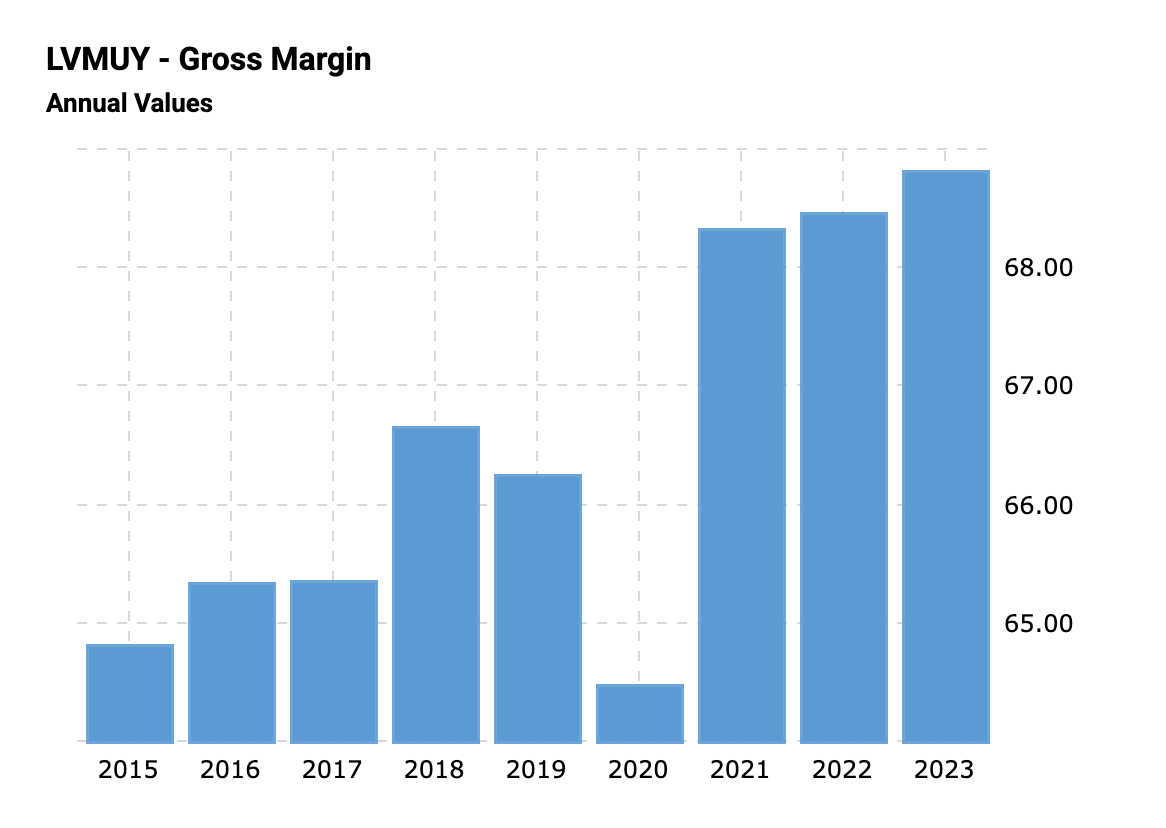
To this displaced 2.5%-ers life seems more expensive each year.
Additional Indicators / Factors
Poverty in the US has declined slowly but surely:

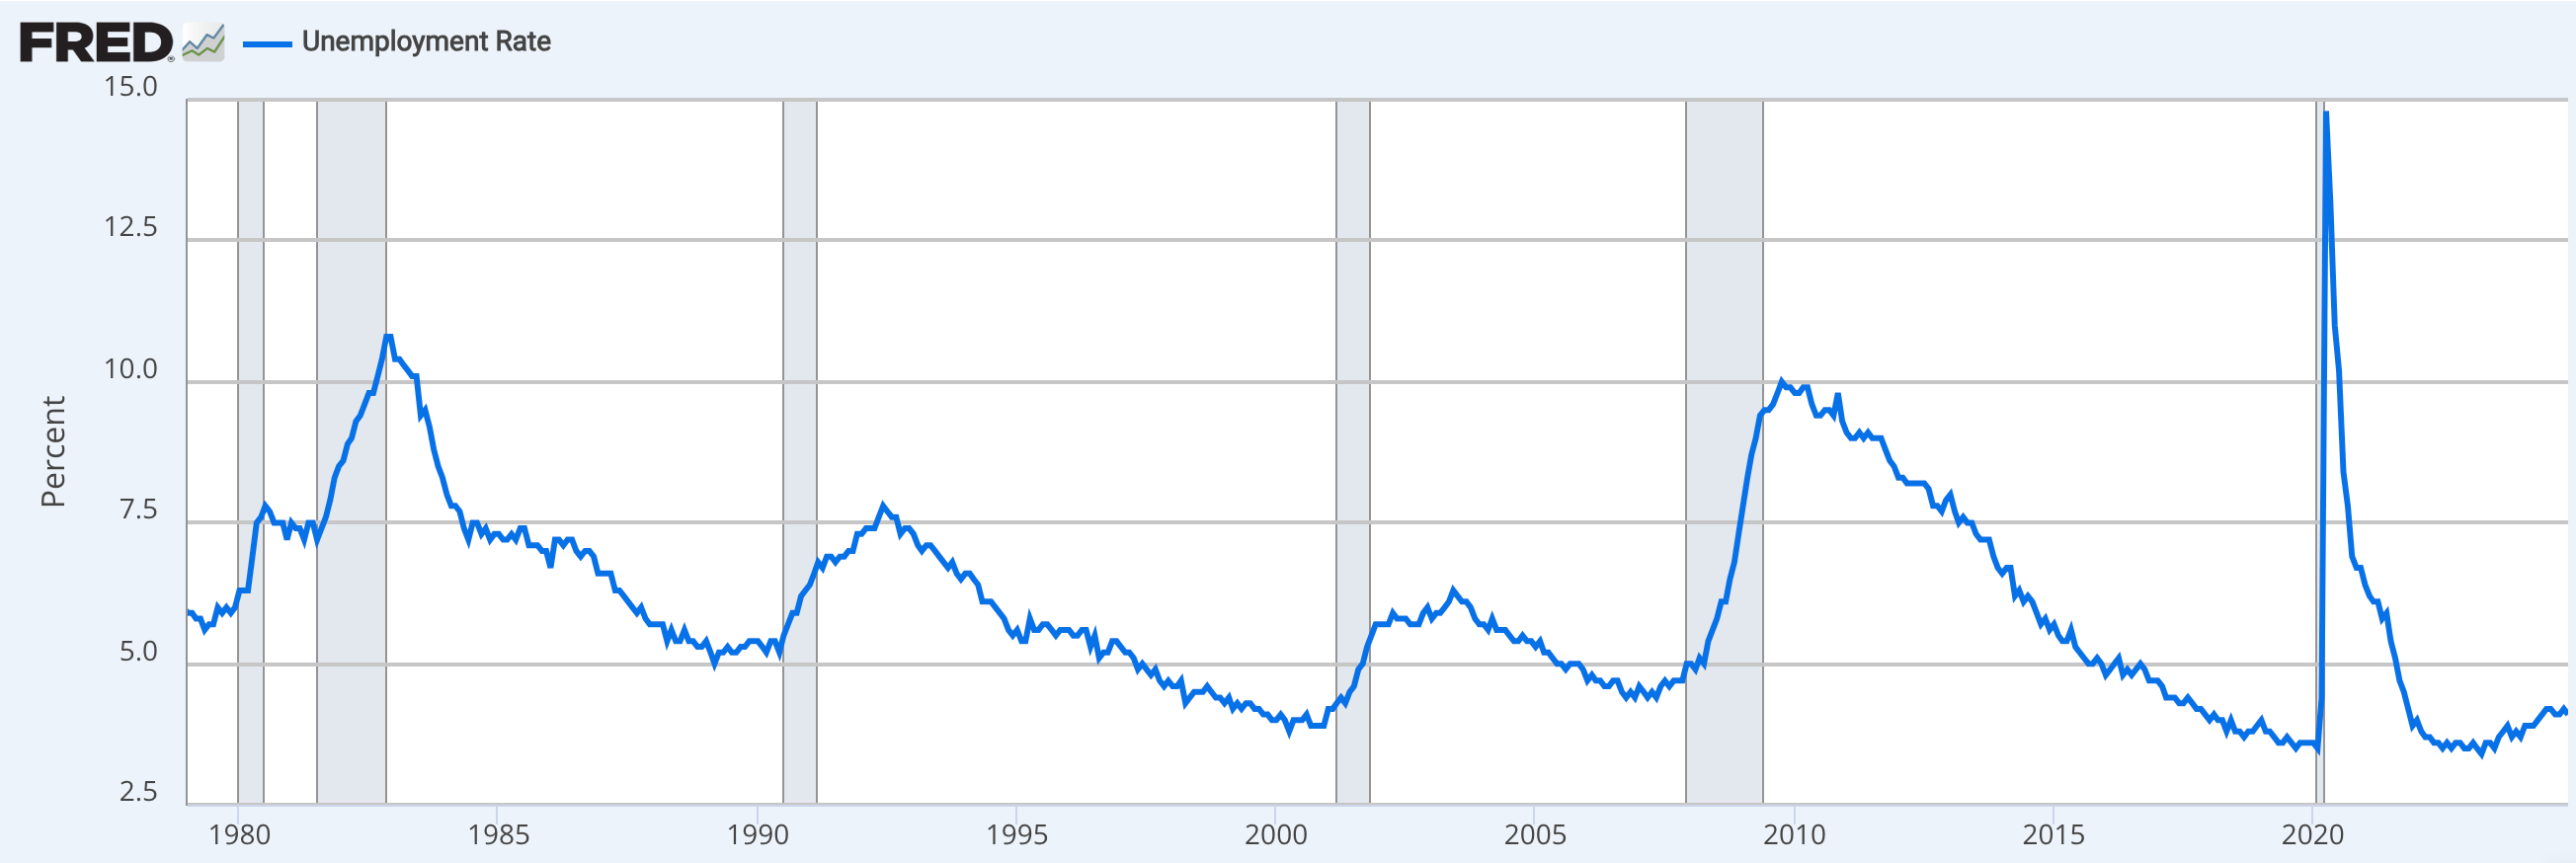
Unemployment has followed that same sort of trend:
Homelessness has been on the rise (this graph is very rough; it is really hard to gather data on homelessness, but this can be some sort of anchor), which lines up with the increasing price of housing.

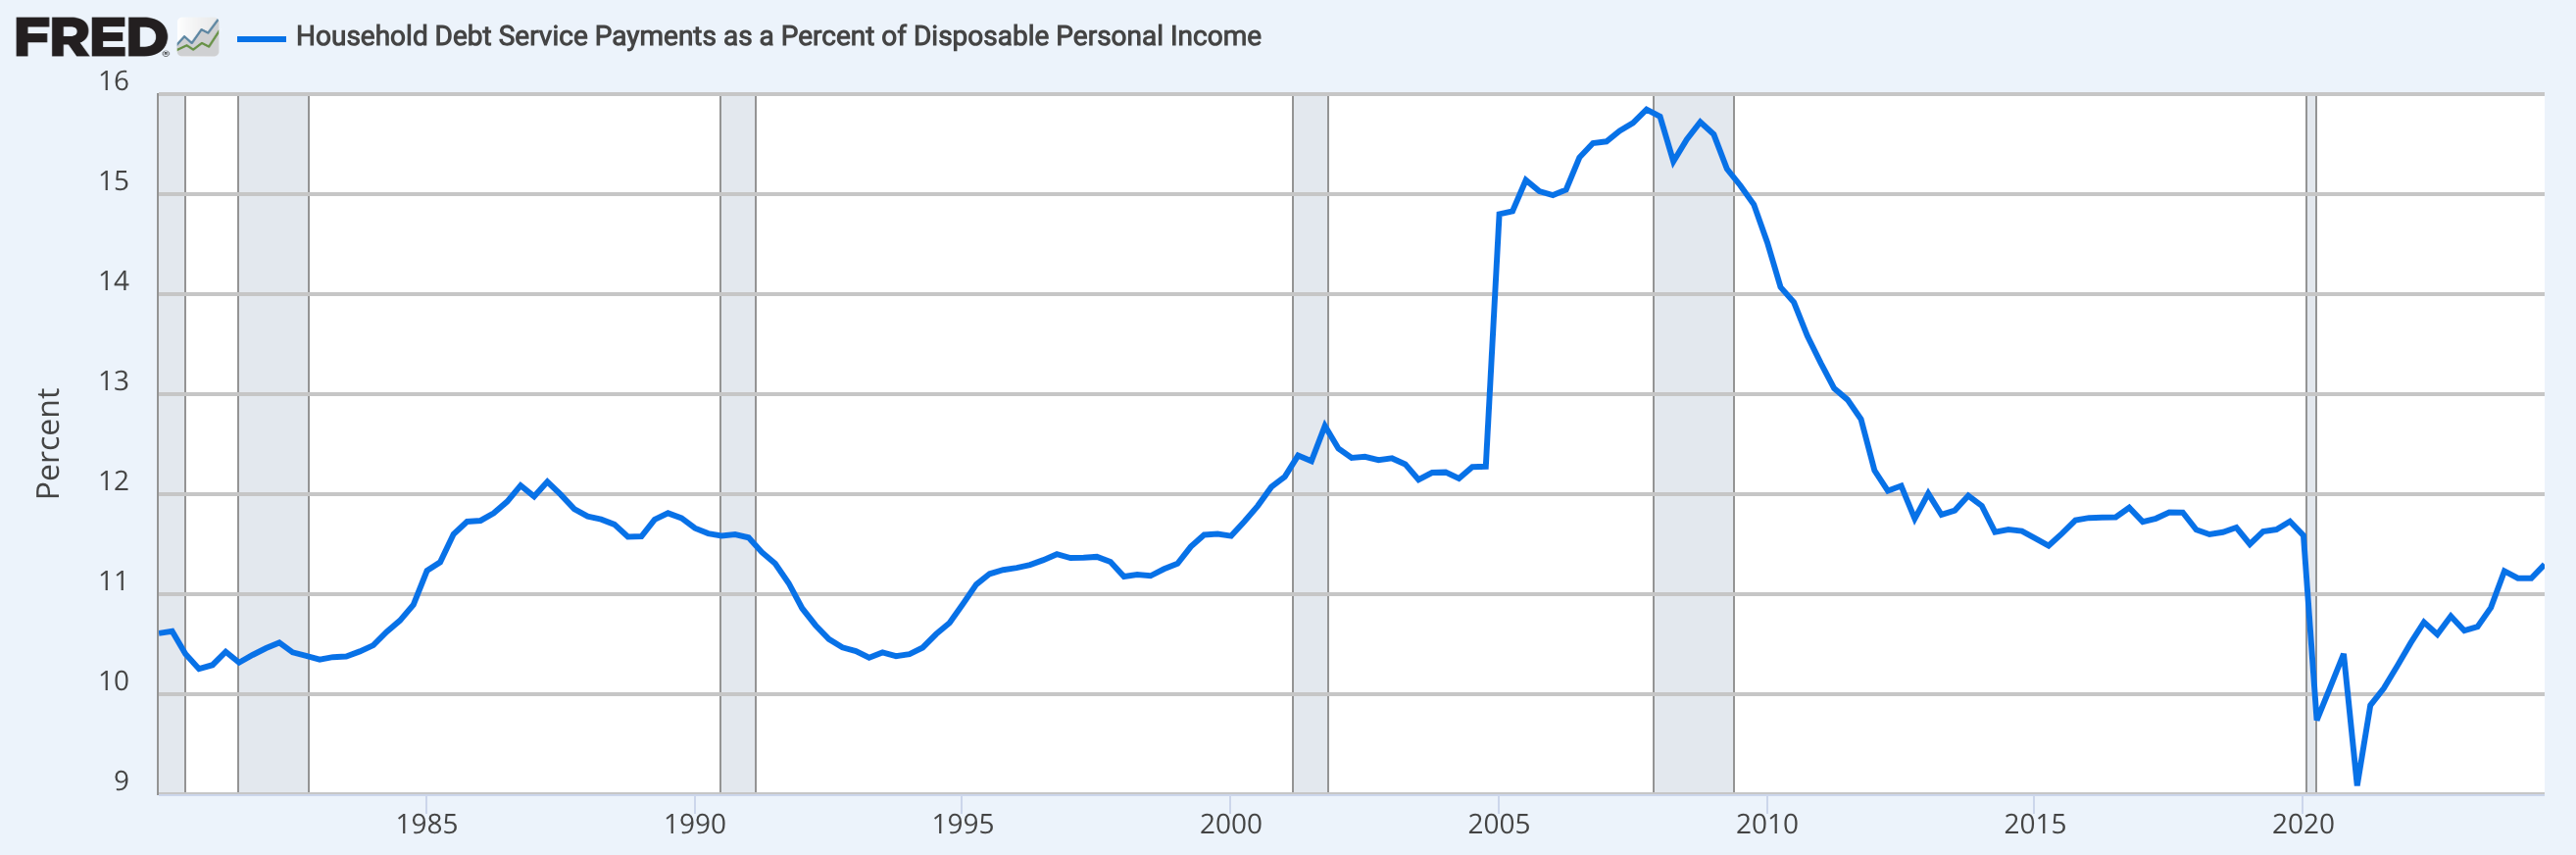
Debt for households seem to be under control, so bare necesites are not being fueled by debt as a response to less affordability.

Social Media Usage is an unstoppable trend

Social media lets us see the world in real time. We can see wars in live stream, we can see other people’s things and trips, we can listen from people we have never had been able to at this level.
A lot of data has been gathered so far, we can bring it all together…
Questions
The conclusions of this mini-research, for me, are more about questions than answers.
My immediate questions are:
Are medical debt and the lack of home ownership weighing subjectively harder on people than the offsetting effects that increases in real wages have?
People are more insecure about their social status, leading them to increase luxury spending, weakening and making them less satisfied with their current financial condition, at the same time. Is the experience of less affordability coming, in part, from the unafordability of luxury goods?
People who are homeless, unemployed, oppressed and other types of disenfranchised can personally put themselves in a the world stage on TikTok and bring light to some issues that many people are not aware they exist. Could viewers be overestimating the preponderance of such cases given the Availability and Recency Bias, especially if the algorithm notices people are drawn to it?
Real Estate Development policy… is yellow taping really inhibiting more supply of housing causing inflation? or is it more complex than this? Besides the private sector doing things like pre-built housing, what is the policy angle to improve supply and control pricing?
Are hedonic adjustments “masking” increases in prices of goods that people actually need like high performing phones, computers, etc? Especially considering that this improvements are becoming fundamental to keep up with the current tech infrastructure. I have a 5 year old macbook pro, and it gasps for air every time I have more than 6 tabs open in Chrome.
As income inequality increases, how biased is income distribution in the US and how much Standard deviation it has? How do wage increases look for the lowest earners? How is poverty actually defined and should its definition change now that we know how much more it takes to develop a healthy human being than we previously thought?

How do taxes and high tax states relate to purchasing power? Are high taxes, not subtracted from the Median Wage calculated here, eating away at purchasing power? How have taxes changed in the span of 40 - 45 years, do they take away more or less share of individual income vs. benefit received?
Raising kids is far more expensive in cities than in suburbs or rural areas. As urbanization increases, so does the cost of raising a family.Wages measured here are individual, when having kids things change, kids need more space, they also need medical care, education, etc. and those are the types of goods and services that have become more expensive through the years. So, three questions here: 1) Has the affordability crisis been hitting families and not individuals? that is why it wont show up in individual purchasing power analysis? 2) Are people upset about the diminishing prospects of being able to have families, adding more to the feeling of deception of the American Dream? 3) How about the relationship between labor hours required to bring in that median income and necessary hours needed for child care, especially accounting for increase in labor productivity?

Conclusion
As with any macroeconomic trend, affordability is more complex than it seems.
Western societies are built under the principles of people being free to develop themselves, taking majority votes as directives for people who govern, equal rights and mitigating, when prudent, disparities in opportunities.
It is impossible to think everyone in a society will be well off. What central planners (governments and institutions) aim for is to reduce indicators of poor quality of life and increase indicators of prosperity. Reducing poverty, unemployment, crime, disease, etc. Improving schooling, quality leisure time, productivity, life expectancy, etc. Of course, they will always come short of what we hope they could do; nonetheless, trying is never an option.
For this goal, its fundamental to quantify the current state of affairs and be able to track its progress. There are structural issues in the US, many people turn to more egalitarian European countries for criticism of the US model. In general, the US economy is the largest and most important in the world. And, depending on what you are looking for, its a country with a high level of general wellbeing.

It is not uncommon for people to romanticise The Good Ol’ Days. In reality, quality of life has been trending upwards with increases in technology and the passing of time. Of course there are particular individuals that would have done better in previous times. But, on average, average people are better off.
In the end, life satisfaction comes from a number of variables and addressing economic concerns is an important one to achieve high satisfaction.
 | A guest post by
|