


How Index Funds get their Indexeness
Exploring the fascinating price mechanism of indexing financial products to dynamic relative values


On my last article I talked about Blackrock, and gave several examples using the IVV index fund as a tool.

That got me thinking about how I find the price mechanism for Indexing Index funds really cool. And that is what I want to explore today: a simplified explanation of how this happens and how precise it actually is.
Context:
An Index Fund is often confused with Exchange Traded Fund (ETFs). They are similar, but not the exactly same:
An ETF is any pooled investment vehicle that can be bought or sold as a stock in a stock exchange and they can follow many different types of securities or strategies.
An Index Fund is a pooled investment vehicle that only has the strategy replicating the perceptual performance of an index.
So what is an index? Formally, an index is a statistical tool for measuring the change of a group of representative data. Colloquially, a financial index refers to a numerical value meant to track the change in some quantitative property of a basket of underlying securities (financial assets) grouped together by different methodologies. This in order to understand the general behavior of that set of companies, commodities, etc. that have common characteristics like: size, sector, location, etc. These indexes measure lots of different things like stock markets, volatility, segments, etc. The most famous market index in the world is the S&P 500.
S&P500:
Since the late 50s Standard & Poors (S&P), an American rating agency created the S&P 500 Composite Index. Its purpose was, broadly speaking, to have a more structured and quantitatively rich way to understand the US stock market.
The S&P 500 is a number, and its meant to emulate what it’s technically referred to as: the percent change in the market value of the 500 biggest publicly traded companies in the US by Marketcap.

Calculations of S&P500:
The market cap is what the market thinks a full company is worth if it was to be sold, in real time. There are many nuances to this statement but for practical purposes this is the statement we want to use. (Number of shares usually refers to outstanding shares).
P1 = The price per share of company #1
Q1 = The number of existing shares of company #1
The above expression is what S&P uses to calculate the total marketcap. This number might seem enough, but there are specific situations in which it becomes inaccurate like, for example, when special dividends are distributed it is not reflected on the long term price of the stock. Also, this number would be huge, several trillions of dollars (XX,000,000,000,000). The solution is to get an Index Divisor: this is a number that divides the above sum, it helps adjust to all the relevant nuances and also converts it into a more manageable number:
Standard and Poors makes the adjustments for the divisor through their proprietary calculations, and they are not relevant to this article:

And like that, the S&P500 Composite index, currently at about 5,000 points, comes to life.
What we explained here is only a paper calculation. S&P is taking live market data and making this quantitative representation of a theoretical portfolio of stocks. But some people had a vision: it would be really cool to be able to buy this and earn money from the increase of value of the general market. Why? It's really well diversified, its in the US, its calculated by a reliable company, etc. That is where SSGA comes in.
In the early 90s StateStreet Global Advisors made the first US equities ETF by creating the SPDR, the first S&P500 index fund. Although it wasn’t well received by the sector at first, it eventually ended up revolutionizing the passive investment industry because of its low costs, convenience, tax efficiency, diversification and liquidity.
As time went on, this method of passive investing in the stock market became more and more popular. Warren Buffet’s Million Dollar Bet is a great story related to this surge in SPDR buyers. Now a days, S&P500 ETFs are, probably, the single most popular way to invest in the stock market.
So what, exactly, are they?
the IVV, Blackrock’s version of the SPDR, is the second most popular SP500 ETF today. It currently is priced at about 508 USD to purchase a single share of IVV. The first question would be, if the S&P500’s value is 5000, why is the IVV’s value around 500? The simple answer is that the number is artificially made smaller for the shares to be more accessible and more divisible.

Moving to more important topics. How would someone would go about to replicate the % movements of something like an Index? Lets go through an example or simplification of what the IVV is in practice. Let’s create a hypothetical scenario:
Say that there are only two companies in a stock market, Raccoon Ventures, Ltd. and Otter Capital, LLC. They each have only 100 shares (200 shares in total).
Raccoon Ventures marketcap is 100 dollars,1 USD per share. Otter Capital is worth 50 dollars, 0.5 USD per share.
So the total market cap for this stock exchange would be 150 dollars (for 200 shares). Raccoon Ventures represents 2/3 of that market cap, Otter Capital represents the other 1/3.
If I wanted to replicate the performance of this stock exchange I could buy 1 share of Raccoon Ventures and 1 share of Otter Capital for a total of 2 shares = $1.5 dollars.
So, in my personal portfolio, even though it’s worth 1% of the total market cap, the proportions are the same. My portfolio value is 1*1 + 1*0.5 = 1.5, and Raccoon Ventures represents 1/1.5 = 2/3 of my portfolio while the rest is Otter Capital (0.5/1.5 = 1/3).
Suppose Raccoon Venture’s marketcap increases by 10% to 110 while Otter Capital remains at 50. This means that, now, the total market cap = 160, a 6.6% increase. Raccoon Ventures now represents 68.75% of the market and Otter Capital is the rest.
In My personal portfolio I hold 2 shares 1 for each company. My shares are now worth 1.1*1 + 1*0.5 = 1.6, the same 6.6% increase. Raccoon Ventures,1.1/1.6, represents 68.75% of my portfolio. Which means that my portfolio had the exact same % change as the full market.
And, subsequently, I could just hold those two shares and, as long as no other companies join the market or more complex operations happen, my portfolio will be having the same exact % changes as the market. If the total market goes up 10% my portfolio will go up 10%, if the market goes down 5% my portfolio follows.

That would be a simplified example of what the IVV actually is. In actuality IVV is just a company that holds a big portfolio of stocks that match the S&P500 index in constituents (components) and proportions. Then that company’s shares are sold to investors (these types of bundles of shares are called Creation Units but for simplicity we can just call them shares) and, therefore, each investor who holds shares of the company is indirectly holding (for practical purposes) a % proportion of each asset owned by the company. We can call the company IVV Corp.
If it’s such a simple concept, why couldn’t anyone do this in their house? One of the main problems that Index fund solves is that it would be extremely expensive and time consuming to emulate the S&P500 portfolio by yourself. It seems easy to do for 2 companies, but getting up to 200, 500 or 2000 shares gets complicated and expensive really fast. Even with fractional shares like Robinhood offers, the cost would be substantial. To get this into perspective, a single share of BRK-A (Berkshire Hathaway), the company that Warren Buffet manages, is around 600,000 USD.
Now we know the first part of how this is done. Index funds are bags of stocks that are held in % proportion to how they look in the Index. Shares of the IVV Corp. are ownership of a bag that holds stocks. But were are yet still to explore the most interesting part of about this types of products, the arbitrage mechanism.
Price Control Mechanism:
Some have the misconception that the IVV’s price changes because Blackrock is unilaterally adjusting the prices for them to track the S&P, which is not true.
The Net Asset Value (Fund NAV = Assets-Liabilities) for a fund is the value that tells us how much do the fund’s holdings are worth at current market value. In this case, using the above example, the NAV for the fund would be PriceRaccon*1share + PriceOtter*1share - liabilities of the fund (maintenance expenses, fees, etc.).
Index fund share prices are like any other stock they are set by supply and demand. The objective is for the market price of all existing IVV shares combined = Net Asset Value of the stocks held in the bag (fund).
If the bag has 100 USD worth of NAV at market value and the bag has 100 shares, then the value of each IVV share should be of 1 USD. The price control mechanism is created to ensure this is the case as much as possible.
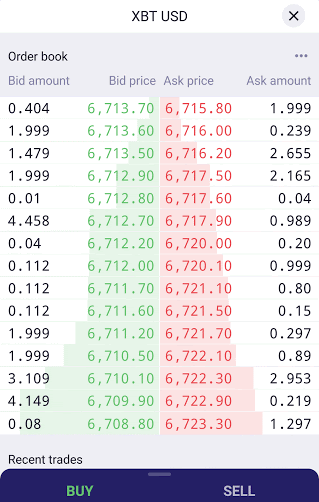
What happens in an exchange: people come to sell shares and other people come to buy shares. The sellers publish a price at which they are willing to sell and the buyers set a price at which they are willing to buy. These publishings are called Orders and together they form an order book. The stock broker’s job is to digitally match the buying side and the selling side and make the transaction happen.
Order books look like the picture below. Sellers want to sell high, buyers want to buy low and eventually transactions happen when a buyer and a seller agree on a price to transact. Bid = the highest price that a buyer is willing to pay, Ask = the lowest price that a seller is willing to accept, The Ask Amount is how many shares are they willing to buy/sell at that price and so on.
This is relevant because it means that the IVV could slide out of sync with the NAV, and, by consequence, with the S&P500. I could sell my IVV at half of the proportional NAV price if I wanted to. And If I had enough IVV I could move the market and de-peg (desynchronize) the system for a while. If people, for whatever reason (panic, human error, adjustment from fees charged, want to mess with the prices, etc), post orders that are not in line with the proper NAV, the tracking would not be precise and people would stop buying the ETF. So how do we solve this? through a price stability mechanism
As said, Index Funds are legal entities (a company) that are allowed to hold securities and emit (create)/redeem (destroy) shares of said company.
Besides Blackrock, there are many third parties involved in the IVV Corp., among them there are ones called Authorized Participants (APs) who work with the ETF creator (ETF issuer) to create and destroy shares of IVV Corp.
In this case (speaking imprecisely): to create a share APs must own the required list of stocks. So they go to the market and buy the stocks as any other person. Then they go to Blackrock to turn that group of stocks into shares of IVV Corp. They put the stocks into a bag and now it’s an index fund share.
To destroy a share, APs must go into the market and buy an IVV share, then they go to Blackrock and ask blackrock to destroy the share, in exchange they receive the underlying stocks. They open the bag, take the contents and throw the bag away.
So let’s suppose the same scenario of a two company market Raccoon Ventures (100 shares) and Otter Capital (100 shares). This time let’s say that the value both companies is 10 USD per share. And the index for this two company economy is at 2,000 points. For simplicity let’s say Index points = NAV. The IVV for this market happens to track at 1/10 that, 200 USD per share and there are 10 shares of IVV. (these amounts are not proportional to the actual S&P vs IVV)
Something happened, in this scenario, where someone was in a hurry to buy and demanded so many IVV shares that the price increased to 220 USD per share. Meanwhile the NAV stayed at 2,000. So, at this point, there is a 10% discrepancy on the value. (NAV - MarketcapIVV = Discrepancy => 2,000 - 220*10 = - 200)
So now the Authorized Participant comes in and fixes the difference through Arbitrage. APs can buy 10 shares of Raccoon Ventures and 10 Shares of Otter Capital for 200 USD, take it to Blackrock and bag it (issue a new share of IVV). Then they take that new bag and go to the market and, at current prices, they can sell it for 220 USD and make a 20 USD (10%) profit.
If APs keep doing this, over and over again, eventually they will flood the market with new IVV shares, this means that supply of IVV will increase while demand stays the same. When this happens an excess of supply is created an the natural effect is that the price decreases. APs will be incentivized to do this over and over again until the cost of doing the arbitrage transaction is higher than the benefit. And at that point the discrepancy or price gap should have closed down.
Now, on the other side of the coin. Suppose there is a situation where there is a huge selloff and the price decreases to 190 USD (5% decrease). While underlying share prices stay at 10 USD per share.
Then the AP can go to the market, purchase a share of IVV for 190, take it to Blackock and redeem it for 10 shares of Raccoon Ventures and 10 shares of Otter Capital. Those 20 shares are can be sold for 200 USD in the market. This means that they had a 10 USD (5.2%) profit for making this operation. Vice versa to the above, by taking liquidity (shares) out of the IVV supply, it becomes scarcer, creates excess demand and by consequence price increases. AP will keep doing this until the gap closes enough where there is no longer an arbritrage opportunity.

Another Very Interesting Example:
An interesting fact about price mechanisms of Index funds is that crypto stablecoins such as USDT use the exact same mechanism to be stable at 1 USD (or whatever currency they mimic). In actuality, the USDT mechanism is a bit more straightforward than the IVV because of they way decentralized exchanges are constructed and because the underlying asset is much simpler.
Even more interesting than that is that Tether or Circle (stable coin issuer companies) have a great business model. Essentially, as Matt Levine (great financial journalist) has said, they are unregulated banks that hold billions of USD on reserves and they are able to invest into treasuries and keep all the proceeds.
Precision:
These types of price mechanisms are all over the financial industry and they work extremely well. From USDT to IVV, they are really reliable ways for things to track other thing’s prices or quantities.

IVV is so precise that the average tracking error (absent costs) was 1 Basis point = 0.01%. The really imprecise ones track an average error of about 46 Basis points and the average comes in at 8 basis points. All this numbers quantified at the end of 2020.

This arbitrage is happening all day every day, the market moves extremely quick and there are so many moving parts that there will always be a very very slight discrepancy. In this case, the more discrepancy the higher the AP’s profits from arbitrage, this means that they thrive in environments and periods when there is really high volatility because the markets move faster and more aggressively.
Conclusion:
Most of the tasks and concepts in finance sound more complicated than they are, but sometimes you run into some really really complex modern mathematical, economic and statistical challenges. After running into the problem, usually, some really smart guys come un with really creative solutions that work perfectly, and these are the types of things that are so fascinating about the financial industry. Not only that, but these types of funds have had all sorts of interesting implications for prices and liquidity for the markets that are really cool to explore.
 | A guest post by
|