


FinanceBro Guesstimate?
Assessing the precision of equity analyst estimates


The FinanceBro concept has been on the rise in corporate culture. Being a FinanceBro is a very complex thing. Mostly, it involves: working in the financial sector (or related), taking yourself waay too seriously and wearing a lot of pattagucci vests.

The finance industry, as I have said in previous articles, is very striking to the naked eye. These Financebros are often really well spoken, come from the best college programs (bachelors and masters) and work in the most important companies on the financial sector. But, in many cases, they have really standard roles and activities within their responsibilities. These roles require lots of hours, lots of politics and a really high stress tolerance. And, in return, they get above average salaries per year (which can become average per hour), a prestigious stamp in their CVs and really funny memes made about them.

These companies are often: Banks, Investment Banks, M&A, Private Equity, Asset Managers, Stockbrokers, Financial Consulting, Fintech, Insurance, etc. And include really prestigious names like Goldman Sachs, Bank of America, Apollo Global, Morgan Stanley, etc.

As a side note to the long hours claim, there was recently news about a Bank of America Banker who died after working a 100-something hour week setting off a whole bunch of criticism and controversy regarding corporate practices. Personally, I went to a school that went through a similar controversy regarding academic rigor. This seems interesting to be discussed but it will have to be some other time.
Equity Research:
One of the important positions in these banks are Managing Directors (MDs) and Senior Analysts. More precisely regarding this article, MDs and Senior Analysts for Equity Research. Equity Research departments are responsible for having their eyes in public companies all of the time and creating research, analysis and valuations in order to help their clients have a better understanding of the market. Analysis sometimes comes in the form of Analyst Expectations, where these MDs or Senior Analysts try to forecast future earnings and sales for companies and use those forecasts in order to issue an opinion of what the price of the stock should be, given the information that is currently available to them. Usually, these teams are in charge of tacking specific companies.
These reports are expensive and look like the one below:

Normally they include:
Price Estimate & Forecasts: reports include forecasts of things like earnings and consolidate everything into a valuation and a target stock price
Recommendations: the report recommends readers to Sell, Buy or Hold a stock according to the comparison of current market price vs. price estimate
Informational Updates: news about the company. Financial and non financial
Investment Thesis & Analysis: papers usually go deeper into the supporting arguments for why that recommendation was issued.
Disclaimers
These banks decide to cover companies for several different reasons like being a client of the bank, being a very large or very popular company, demand from their clients, etc. Regarding being the client of a bank and having their analysts cover your company might have some conflict of interest issues, but more on that later.
Cash Flows:
So how do Analysts reach a conclusion of how much a company is worth? the answer (simplifying) has 3 letters: DCF. Which stands for Discounted Cash Flows. More specifically, the Industry Benchmark for valuations is the FCFF/FCFE, Free Cash Flows to the Firm/Equity. There are additional valuation methods like Multiples Valuation and Asset Based Valuation, but the most prominent one is the DCF.

Free Cash Flow (FCF) is the money that a company has left after accounting for all its expenses and reinvestment in important assets. In a small private company FCF can be seen as the money a company’s owner would be able to get out of the company as dividends without affecting its normal functioning. This is different from Net Income. We use FCF instead of it because Net Income deducts expenses where cash does not actually go out of the company, like depreciation. So FCF is often regarded as a really good measure of a company’s profitability and performance.
Let’s explain this with an example. Let's say that Im considering buying a theme park company called Free Willy, ltd. from Willy himself. How would I get an idea of how much is it worth?

The most important thing about buying a company, in most cases, is to understand how much money will I, the owner, will be able to get out of that company. There are additional reasons for purchase like horizontal integration, platform acquisitions, etc. but they are out of the scope of this example.
So I ask Willy for his financial statements and dive into his Free Cash flows. These free cash flows will tell me how much money I will be able to receive as dividends once all expenses are paid and all the assets in the park have received the necessary reinvestments to, at least, maintain operations at current performance.
Let's say that Free Willy, Ltd. has FCF of 100,000 USD per month, $0 in debt, no excess cash and FCF don’t grow. Willy comes to me with the news that he will be willing to sell at 30M. First thing that I will check is how much is the risk free rate at. Why? Let's say that I can buy a 10 year bond from the Federal Reserve that gives me a 5% dividend each year.

If I Invest 30M into that 10 year bond I will get 1.5M a year in interests. Willy is selling me something at 30M that will give me 100,000*12 = 1.2M a year. Clearly I would not go for the trouble of of managing a theme park, that would require a lot of work, for less money than a bond would give me.
So I will come back to Willy with a hell nah. The idea of comparing one investment to another to understand the opportunity cost of my money is the basis of the DCF. But the real world gets really complicated when getting to compare two investments.
There are different risks involved and all kinds of uncertainty that makes it difficult to asses a-priori, what is the best use of our money. The main source of uncertainty is not knowing what future cash flows will look like and what will be the future opportunity cost of money. If the Free Willy Ltd. would assure me that its FCF increase 60% each year, then it would become a much more appealing investment opportunity than the 10 year bond. And part of how we determine its attractiveness is to match up future growth vs. current earnings by bringing future money to the present.
Net Present Value:
Money loses its purchasing power over time because of Inflation. So $100 in a year will actually be less valuable to me than $100 today. This is why economists came up with the concept of Net Present Value (NPV), and its purpose is to compare apples to apples. Let’s suppose that inflation is always 2% and I want to understand the purchasing power of $100 USD in a year. So I get the NPV of those $100 through the following calculation:
So this NPV tells me that $100 in a year would only be able to buy what we can buy today for $98.04
More precisely, if I make the assumption that inflation will always be 2% I can calculate what $100 would be able to buy in any future year, t being the amount of years in the future im looking into.
NPV is a key element for the DCF because if we want to understand if we are satisfied with out investment, we have to account for how much will the money given by this investment will be worth in the future.
Let’s seee an example. Free Willy Ltd. has 100% certainty that its FCF will grow 50% each year for the next 2 years and the 10 year bond will give me 5%.
For the first two years I will receive 3M from the bond and Free Willy will give me 3M as well. Which might seem the same, but let's adjust for inflation.
Bond still wins. So it's not only about how much, the “when” is also a key component of investment comparison. Under this scheme, Willy would still be a bad investment, even with the huge growth. Let's expand this a bit more:
Now Free Willy Ltd, because of the huge growth in its FCF, is starting to outperform the bond’s real income. If this numbers are fixed, I will get more purchasing power out of Willy than the bond.
This process is called Discounting Cash Flows, 2% is the Discount Factor for our example. This factor determines the opportunity cost of money over time. It’s usually a percentage. In economics we use inflation, in finance sometimes we use the Risk Free Rate but, for Equities Research, the gold standard for opportunity cost of money, also called Cost of Capital, is the WACC or weighted average cost of capital.
WACC:
The benefit of lending out money, like in bonds or giving a loan to a company, comes in the form of interests. Interests must be paid regardless of the company’s performance (in most cases). The benefit of buying shares of a company comes, in a really simplified version of reality, as dividends distributed by the company.
A loan is certain on the amount of money you are entitled to receive, a dividend’s size depends directly on the company’s performance. This is why it's considered safer to lend out money (of course this has nuance) than buying shares in a company. This results, of course, in investors demanding more money as compensation for absorbing the extra risk.
Each company, depending on several factors like: sector, country, business model, etc. is attributed a different level of risk. For example, property rights in the US are much more well established and protected than property rights in Yemen. This means that if we had the exact same company, same income, same growth, etc. but one is in Yemen and the other one is in the US. The company in Yemen would be considered a much riskier investment because of political instability, therefore, investors will demand much higher returns from the company in Yemen.
Companies finance their operations and growth through, both, getting loans and selling shares. As a result, each company has a different level of debt and, as said, demands a different return on shareholders. The WACC’s job is to streamline the process of risk assessment by incorporating all these elements into the discount factor. The result is a discount that tells us, for a specific company, how much yearly return on investment is required as a minimum for the risk of investing to be covered.
The WACC looks like below:
For example, using GuruFocus as an example, Apples WACC is 11.23%, Teslas WACC is 15.32%, Microsoft 10.63%, etc. This means that stakeholders demand 10.63% yearly return on investment as a minimum for justifying the risk of buying Microsoft shares.
Now we understand the following things:
Free Cash Flows are a great measure of a company’s returns and profitability
The Net Present Value of future income to understand the purchasing power of future income
The risk profile of each company is different and we should demand higher rewards from riskier companies
Companies finance themselves through getting loans (debt) or selling shares (equity)
So we can incorporate all these into one theory. We use the FCF as a measure of profitability and use the WACC as a way to account for the value of money over time as well as the specific opportunity cost and risk of investing in each company. The WACC is not 100% precise in assessing opportunity cost, people have different views and likelihoods on different risks, and if you ask 10 different people if the market will go up or down in the next 6 months you will get really split answers. The WACC is where things start getting spicy.
Now we only have one thing left to do, forecasting cash flows, and here is where things get really spicy.
Forecasting:
Forecasting is a really tough business. Straight out of the bat: no one knows what is going to happen tomorrow. There were no Investment Bankers forecasting in 2019 pricing in GDP decreases in 2020 because of Covid19. There were no Banks pricing in the upkeeping of the European Central Bank’s interest rate because of the Houthi attacks in the Red sea (probably /mostly), there were no Private Equity firms pricing in a huge transitory risk-off stance on markets because of SVB’s bankruptcy. Some of this events have short term effects, like the SVB collapse, others completely change the structure of an economy for many years, like Covid’s lockdowns.
Below I place my take on the reliability of Forecasting Cash flows compared to the reliability of returns of different assets over long periods of time:
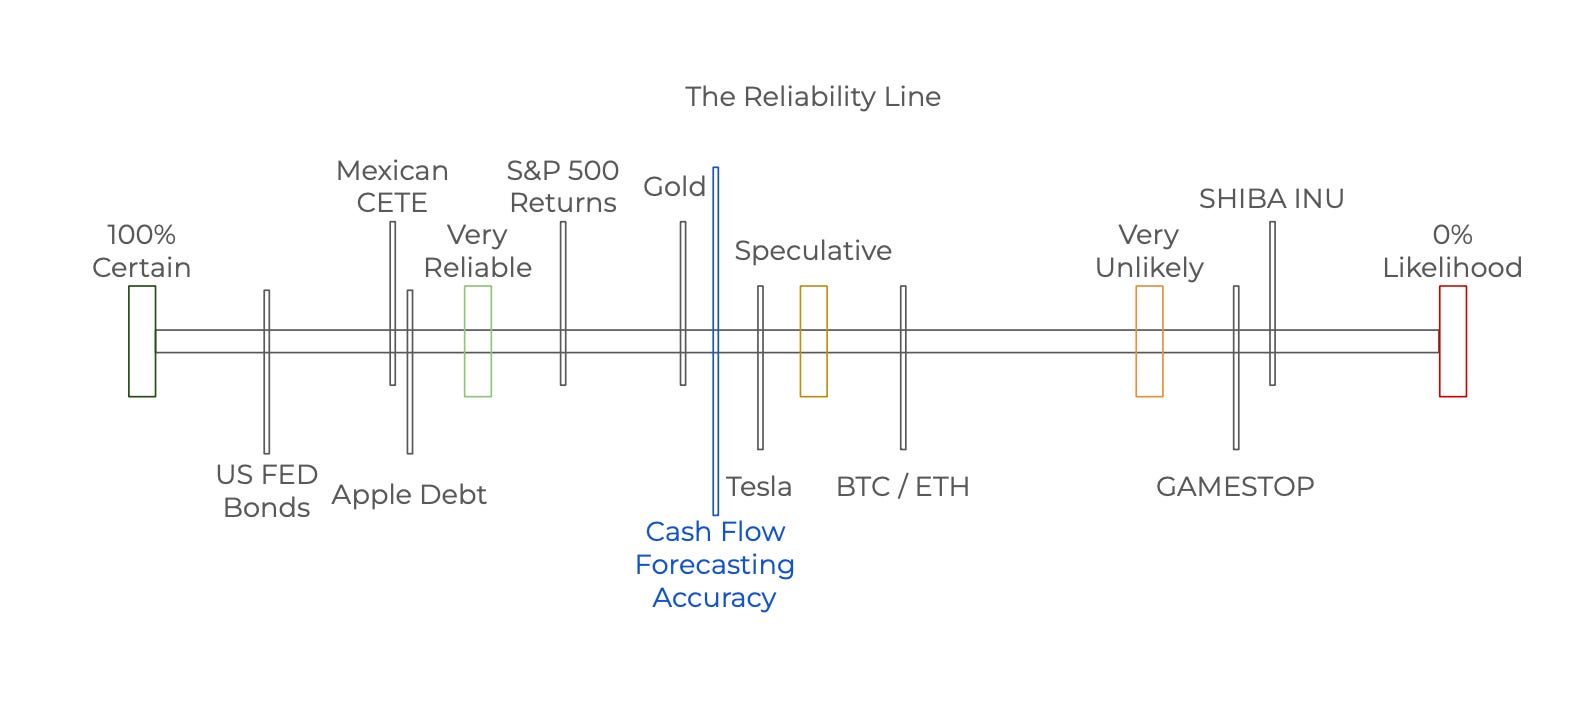
So, with that huge disclaimer out of the way: Analysts have a lot of different methods to estimate future company earnings. Normally, Analysts rely on the company’s historical income growth, similar company income growth in different stages and something called a PEST analysis. PEST tries to account for the effects things like changes in regulation, technological improvements, cultural trends and macroeconomic environments have in the company’s growth.
As an example, let's go back to Free Willy Ltd. We get the company’s financials for the last 7 years. We dive into its competitors like Sea World and Six Flags. We dive into regulations of things that impact the firm, like animal cruelty laws, safety regulations, etc. We search for market studies of the trends in demand for theme parks. Understand the technical feasability of new and cooler park rides and understand if the economic cycle will be favorable or not to this business.
Using this data + statistical tools like Regressions and Correlations we forecast that Free Willy Ltd. will increase its cash flows 7% each year for the next 7 years, and after that it will only grow 2% each year for infinity. We assume it grows for infinity because businesses don’t usually plan on closing, they plan on continuing to thrive for many decades or centuries. The further into the future money is received the less it is worth and the less precise we have to be with forecasting without affecting the overall result. This is called a Terminal Value .
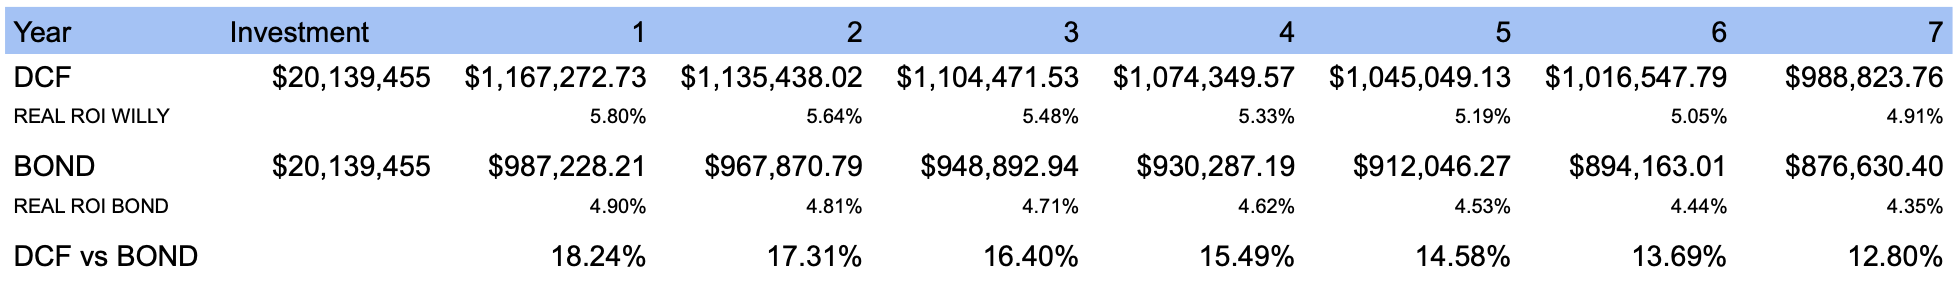
We also note , after doing the opportunity cost analysis, that the WACC for this company is 10%. Finally, we know last year’s income was 1.2M and we get on to calculating the DCF
Calculating A Company’s Price:
So now we know that, because of the risk profile and growth potential, Free Willy, Ltd. is actually worth less than Willy initially asked for at 20.13M. Let’s say that the company has 1,000,000 shares. This means that the target price per share for the company was forecasted at $20.13. And purchasing stocks at below that price is called buying at a discount. Meaning we are purchasing shares below the Intrinsic Value or “Fair Value” which is Warren Buffet’s favorite thing to do.

After getting the discounted value of the projected cash flows, we can estimate the real return on investment at the calculated price. By “real return” we mean that it is already adjusted for the risks associated with all parts of the company through the WACC. And we can see some important things:
At the 20M price, the real returns per year, even when accounting for the risk premium, are higher than the 10 Year bond. This means that, on average, the returns of the company are projected to outperform the bond.
because the WACC>Yearly Growth, the real return on investment decreases each year as the opportunity cost of money becomes larger than the growth of revenues each year.
Because the bond is considered zero risk its discounted by inflation, which was 2% in our example, meaning that, although its performance does not compound (without reinvestment), the decrease in real return was slower than the company's.
The company becomes less attractive vs the bond each year.
This type of analysis is kind of unorthodox in the financial industry, its not so common for people to compare DCFs to inflation adjusted bond returns, but I think is a vital example to understand the complexities of deciding what investment best suits a specific situation.
But let's leave William alone and see, in reality, how does this model perform.
Why DCF?
Economic models, which are just a bunch of mathematical equations, often reach what is called Perfect Competition. Under perfect competition something interesting happens, because there are no barriers of entry to produce a good, the market floods with companies and they compete in prices so hard to the point of none of them making profits.
In these models, all companies and goods are exactly the same, so the only thing that matters is price. Each additional company that joins the market increases supply and, because entering the market is basically free, people will open companies until there is close to zero benefit to extract. Why? because .0000001>0 and calculous knows it.
On the other hand when the market is saturated, suppliers will close shop when supply is high enough that it pushes market prices below costs, incurring loses on the company (loss per unit sold), then companies leaves the market and the balance of zero profit is reestablished.
The DCF model is based on this type of competitive market, in finance its called Efficient Markets Theory. Under efficient markets information is perfectly transparent, therefore there is no room to make excess profits from some asset. If we had 100% certainty of the future cash flows of a company people will seek to profit from this flows. More and more buyers will show up until the benefit of the operation of purchasing a company is close to zero. Why? because mr. financial equation is not a person with needs or hopes, it just knows that 1>0. Of course, things in practice get much more complicated.

DCF in Practice:
The Senior Analysts and Managing Directors that make this predictions make a lot of money. They usually have Masters or PHD degrees. For example, an MD in Goldman Sachs or Morgan Stanley makes anywhere from $554K-$963K per year and 445K-758K, respectively. A Senior Analyst at the same firms can make 85K-137K each year and 97K-136K. For contrast, the average yearly salary in the US is S59,428 per year. So these people are making 1.4X-16X more than the average person. And for that amounts of money, plus the company’s expense budget an access to data, we should expect incredible precision in estimating values right?

Well, it's not so clear. So here is a quick analysis. We checked the Analyst Estimates from the top banks trying to estimate the prices of 15 large stocks in the following industries: tech, banking, industrial, food, pharmaceutical, hardware, entertainment, software, real estate, logistics, retail & transport.
We took out all of the published estimates that had a maximum of 16 days in between each other, to ensure they were working with, broadly, the same information. Then we compared the difference between the highest an lowest forecasted value. The results were the following. The average difference between the highest and lowest estimate was 46%. The highest difference between highest an lowest was of 3.4X.
Disclaimer, this is not an all-out investigation, it's just a glance at some stocks.

These companies actually perform the service of valuation for private companies, and the price is incredibly high, in the millions of USD. Also, private company valuations tend to be more complex than public ones because of the small amount of information available.
Imagine paying a couple of million USD for a valuation at Barclays Bank and getting a 100M valuation, then going down to Morgan Stanley, paying another couple of million USD and getting a valuation of 147M. That might seem crazy to some people, but is actually quite common.
When making valuations of public companies people usually agree on the WACC, which is not always true for private companies. Nonetheless, in both cases, forecasting the cash flows is where things get hairy. Some call it an art, others call it a scam.
Personally, I think this is missing the point.
When people make decisions about which analyst to trust, the answer is: the mean. This is called a Concensus Estimate. A consensus estimate can be calculated a million different ways. A simple way to do it is to get the average of all the analysts that report for some company and use that as a target.
We can use our same study to compare Analyst Estimate Consensus to market prices at an arbitrary date within the scope of the published price target (6PM Mexico City Time May 14th 2024), we get an average of +/- 13.2% difference.

A 13% variation, given the variation within estimates, might not seem so aggressive at first glance, but let’s tug deeper from this concept.
Reality Is Complex:
First of all, these analyst estimates are changed periodically, usually 4 times a year after quarterly earnings come in, so a 13% range within a quarter is really really high compared to the average quarterly movements of a stock. This is almost 3 years worth of interests from a treasury bond that could be lost or won in some weeks.

Second, but most important, this not exempt from being a self fulfilled prophecy, because of two things:
Most people will assume that big banks should have the upper hand on predicting prices. These banks constantly advising their clients on buying the stocks they like. Therefore, these analyst estimates have really high expectation setting power in all kinds of investors. Investors are often buying at the advised price, not because they personally did the valuation, but because they trust the analyst’s judgement on it. If enough people like using analyst estimates, the price will trend to them. This may not necessarily be the case, but it would be really hard to disprove this statement.
Banks have lots of money and their role on buys and sales of stocks really sets the pace in setting market prices
If all the banks use roughly the same model for calculating the price, it is not unfathomable that results might correlate with each other, this doesn’t actually mean that a DCF is a part of fundamental reality, its just a convention.
Adding on to the second point: these analyst estimates can make or break generational fortunes. And, although they are highly regulated, bias, corruption, conflicts of interests, and other noise (not necessarily fraudulent) have been recorded to impact the estimated price.
There is this really funny quote on a Forbes article relating to price predictions, the article discusses a book called A Random Walk Down Wallstreet, by Burton Malkiel: “A blindfolded monkey throwing darts at a newspaper's financial pages could select a portfolio that would do just as well as one carefully selected by experts.” The author of the article goes on to say Nice trick! What’s the deal? No trick. Just send me $10,000 and I’ll sell you the best stock-picking monkey that money can buy!”
So, stating all this, I’m going to explain why trying to say scam or art is missing the point.
Again, Why DCF?
The reality is that people want to sell their companies, for many reasons. Society really benefits from company continuation as they become better over time. So we need some way to fulfill this societal need. We may not have been able to find an oracle solution to this, but having rules of thumb of how much companies should be, by comparison, really helps transactions happen.
Given the current state of affairs, DCF is not a terrible approach to understand the value of some company. It tries to incorporate current + expected performance, market + idiosyncratic risks, comparable financial metrics and an indefinite operating horizon. But it is not, by any means, a bulletproof solution. 4 points are important:
Is there room in the market for 2.5M dollar valuation services? Yes. When a transaction worth 5B or 10B is taking place, paying <0.1% commission for making sure the top dogs are doing the legwork using the best tools is something that really brings value. It lubricates the transaction and it is probably worth the price. I, at least, would do it that way.
Do you need 2.5M to create a relatively accurate interval of how much a company might be valued at? No, absolutely not. Any fresh Finance graduate can perform a reasonable valuation in their house with 10 hours of work. In some cases the graduate might even outperform the precision of the 2.5M valuation.
Is it positive for companies like Goldman Sachs to be creating estimates of prices for stocks, in spite of being somewhat inaccurate? Yes. People are the source of value, philosophically, nothing is inherently valuable, value is just something humans attribute to the things in the world. In the long term, the market does give a general idea of how valuable people think companies are worth, and this is, in my estimation, a proximity to understanding the value itself.
3B - The DCF is a good method? yes, because the theory makes sense and it takes into account future growth (or decrease) in the success of the company, as opposed to other metrics that take the company as it is in one point in time and assess things that way.
When someone walks into any financial consulting asking for a valuation, should they attribute indisputable value to a single entities opinion of value? No, as we saw, a single estimation can be inaccurate, its not relevant where it comes from or how much it costs. The important thing is that the calculations are done properly and the assumptions are well founded.
Conclusion:
Analyst Estimates are shaky business, but they are not useless. The DCF is an important part of the modern world but no one has a crystal ball and anyone claiming otherwise is either wrong or lying. These things are to be assessed over the long term and short-sightedness might seem attractive but it seldomly pays off over long periods of time.
 | A guest post by
|